Reactscape device:space
Latest Site Observations
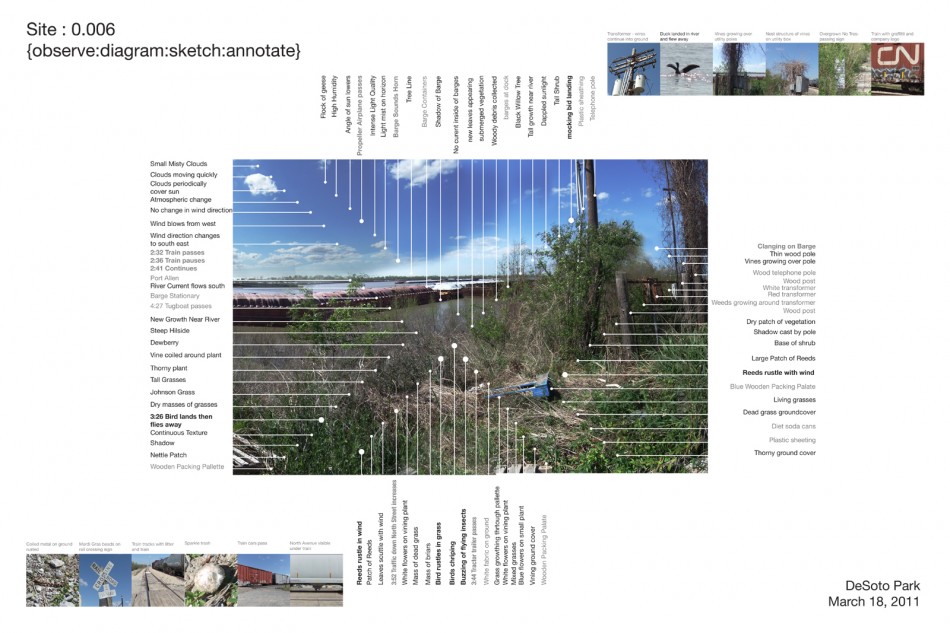
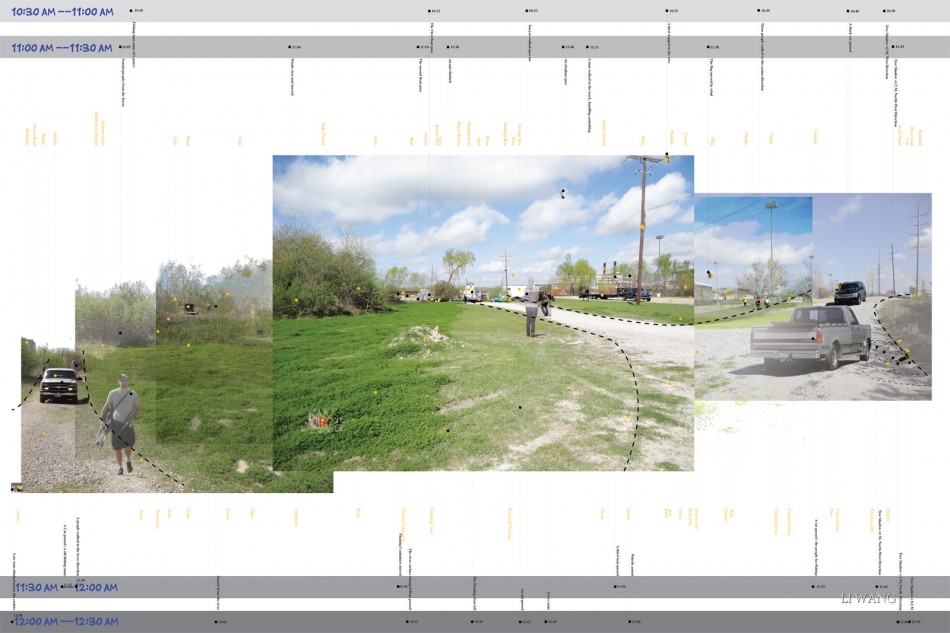
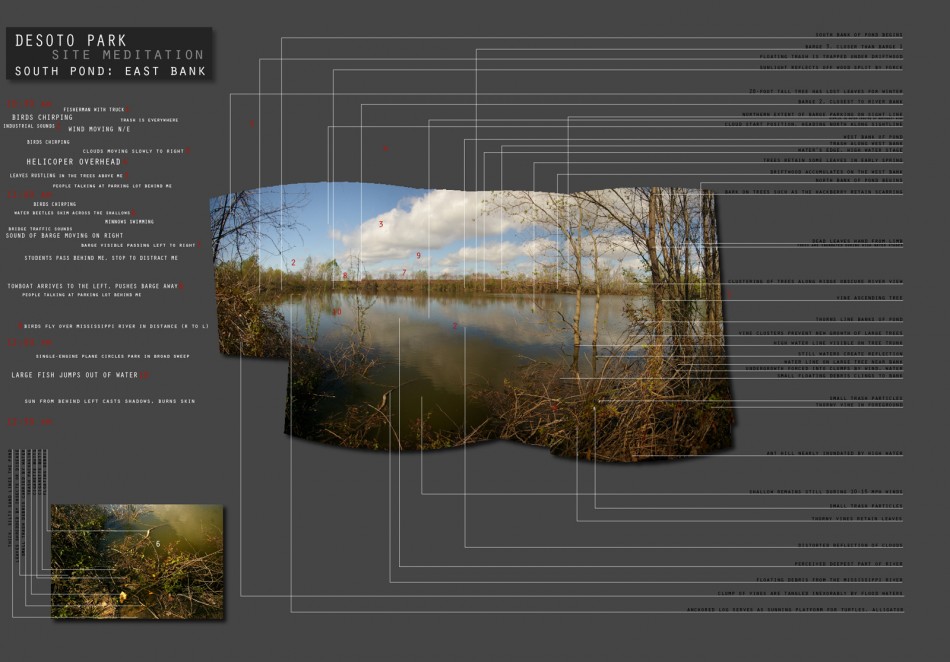
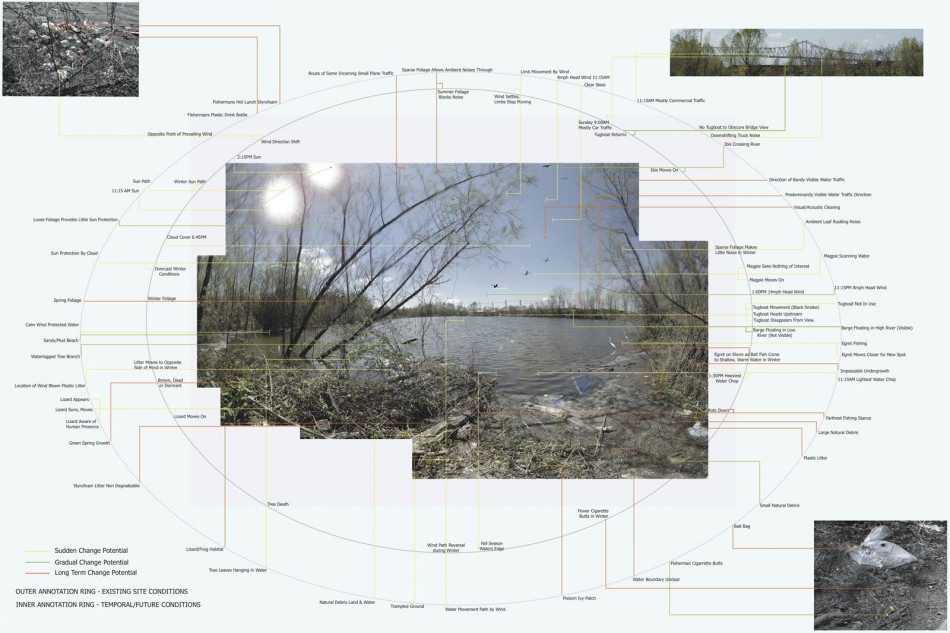
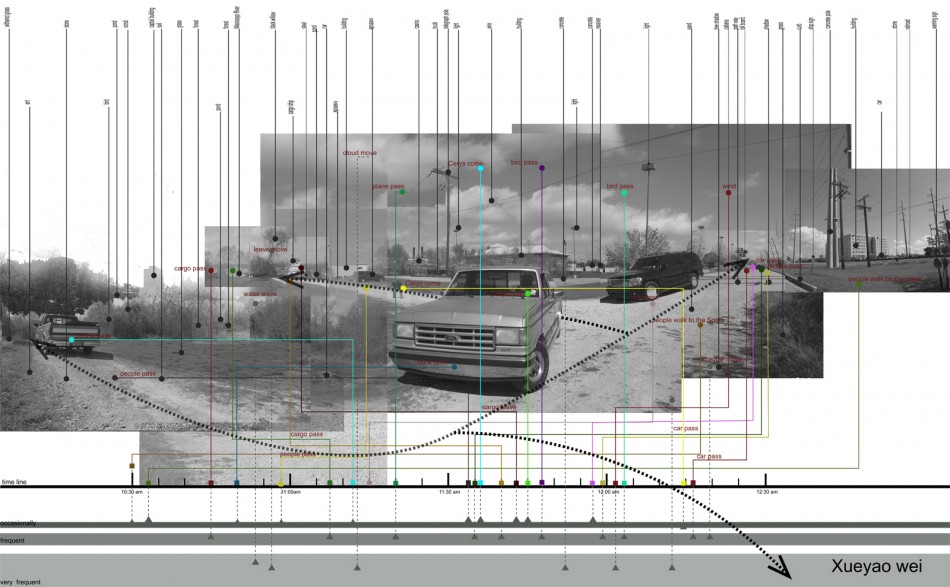
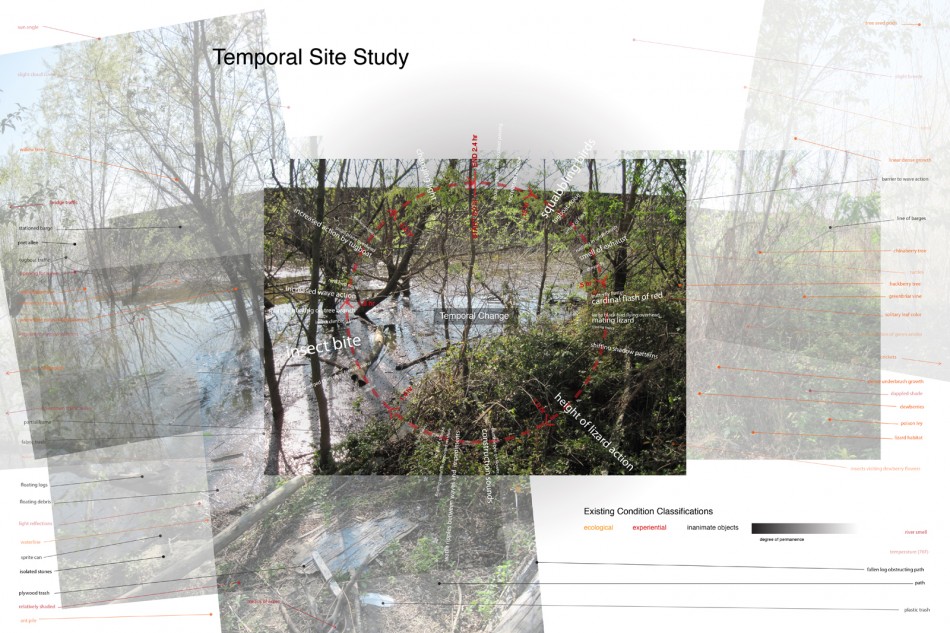
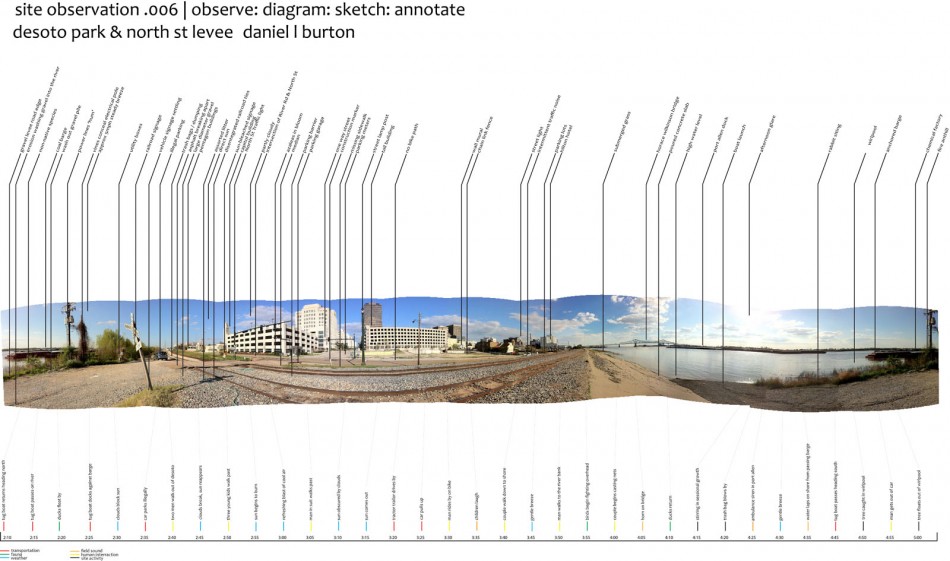
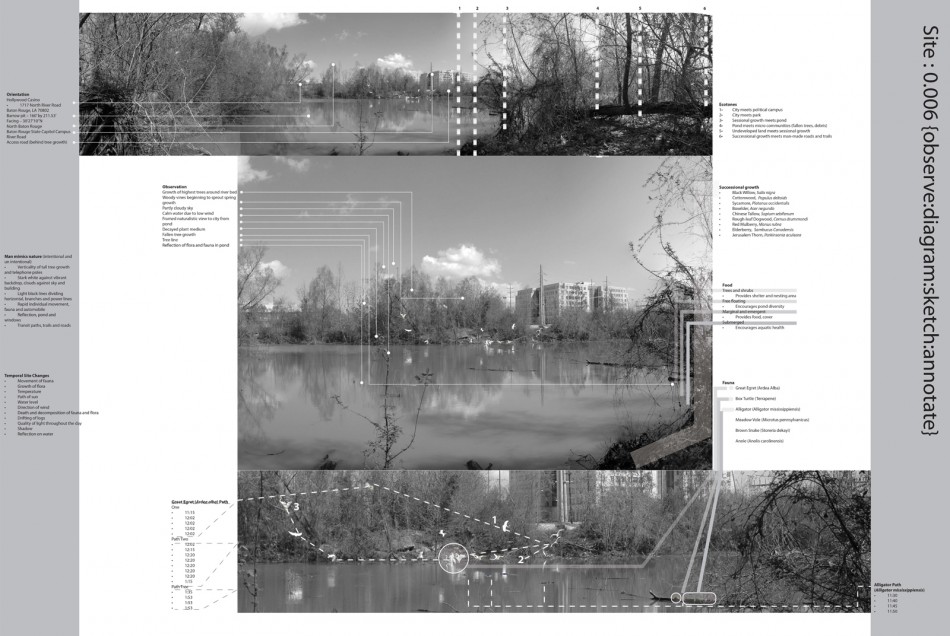
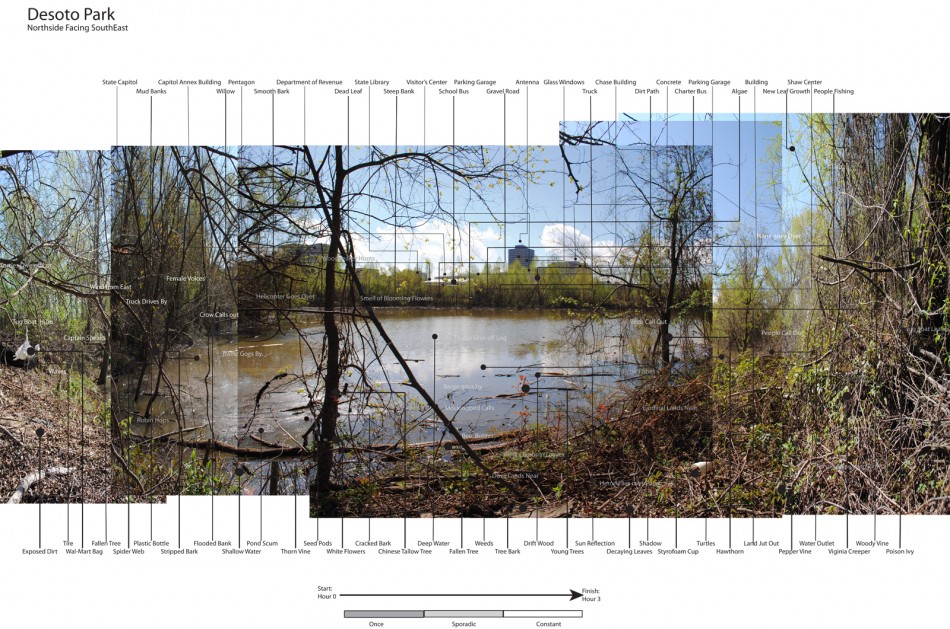
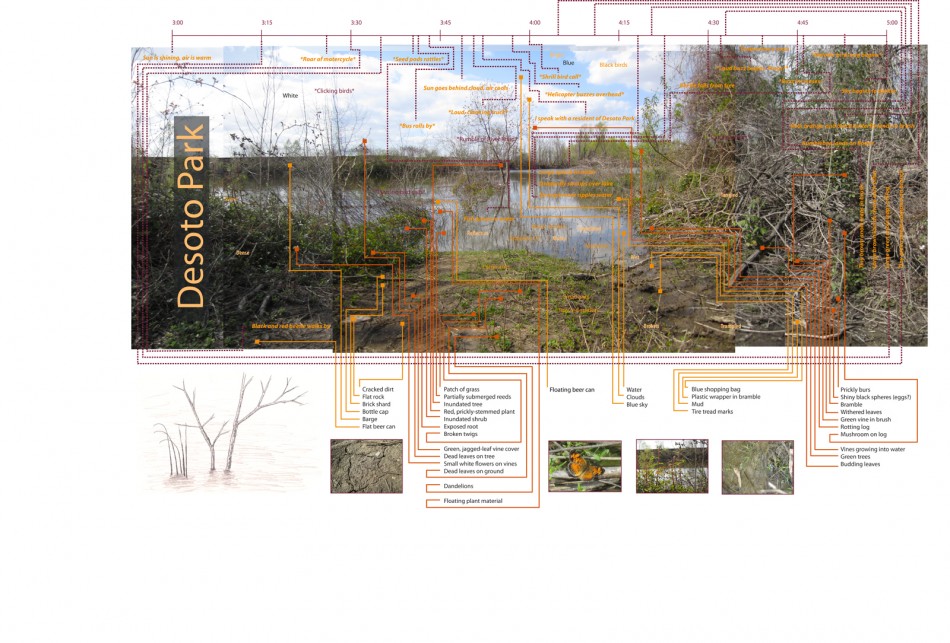
My design studio was asked to observe site phenomena and features through a 3hr site visit this past Friday. Each student was asked to create an annotated illustration that captured 60 observations and 30 events over the 3hrs. While many of the events and observations are initially mundane most students came away with a greater appreciation for the vast amount of changes that are occurring across the site, particularly at the human scale. As a representation and diagramming exercise it is fascinating to see some of the methods used to build hierarchies, express impact or trace movement. You can take a closer look at the assignment here. The illustrations are below.
More to Come …
